Getting Started With Graphite for Metrics/Monitoring
We can deploy graphite (with statsd) through docker using:
docker run -d \
  --name graphite \
  --restart=always \
  -p 80:80 \
  -p 2003-2004:2003-2004 \
  -p 2023-2024:2023-2024 \
  -p 8125:8125/udp \
  -p 8126:8126 \
  -v $HOME/docker-volumes/graphite/configs:/opt/graphite/conf \
  -v $HOME/docker-volumes/graphite/data:/opt/graphite/storage \
  -v $HOME/docker-volumes/statsd:/opt/statsd \
  graphiteapp/graphite-statsd
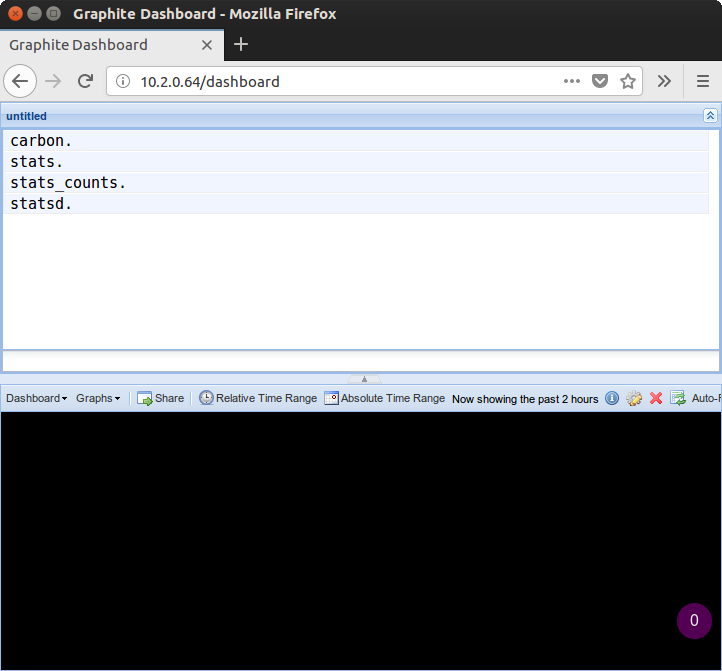
Once that is deployed, you will be able to see the Graphite dashboard if you go to:
http://hostname-or-ip/dashboard

However, it's pretty bland and empty when there is no data, so let's give it some.
Inserting Some Fake Data
Lets create some fake metrics so that we can view them in the system:
HOSTNAME_OR_IP="graphite.programster.org"
while true; do echo -n "example:$((RANDOM % 100))|c" | nc -w 1 -u $HOSTNAME_OR_IP 8125; done
After having run that on and off for a bit you can go to this url:
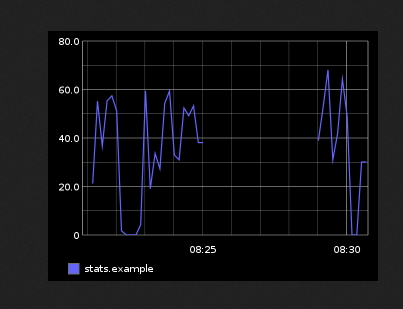
http://hostname-or-ip/render?from=-10mins&until=now&target=stats.example
... and you should see something similar to below:

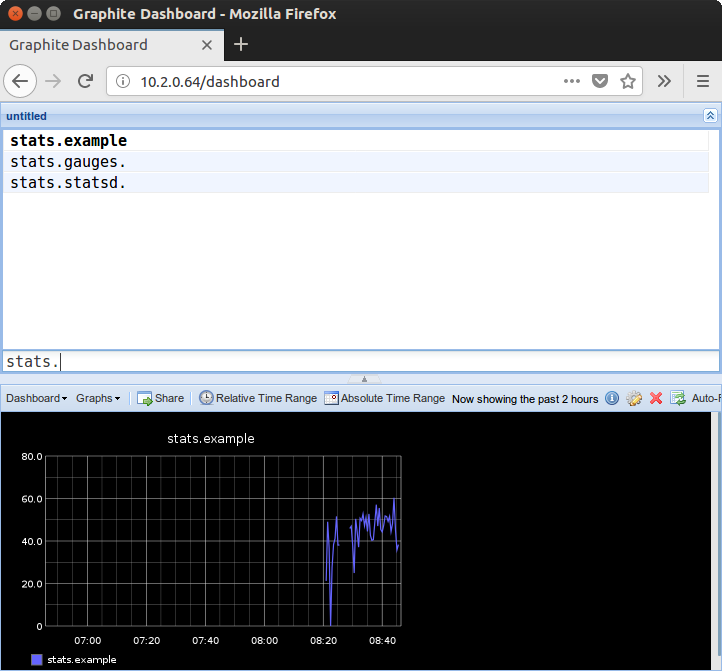
You can add that to the dashboard by going to the dashboard and then clicking stats in the top section, before then clicking stats.example and the graph will appear in the bottom section:

Securing The Dashboard
By default the dashboard uses a default username and password to login as the admin user, so we need to change this.
Go to the url below to login as the root user using root for the username and password.
http://hostname-or-ip/account/login
After having logged in, go to this url to change the password:
http://hostname-or-ip/admin/auth/user/1/change/
Conclusion
Hopefully that is enough to get you started/interested. In future we will look into how easy it is to send events over from our PHP applications.
References
- Graphite Docs - Install
- blog.pkhamre.com - Understanding StatsD and Graphite
- Github - graphite-project/docker-graphite-statsd
- DigitalOcean - An Introduction to Tracking Statistics with Graphite, StatsD, and CollectD
First published: 16th August 2018
