Zabbix - Monitor Temperatures Using Custom Item
Introduction
I have a server that has the lm-sensors package installed on it.
This reports the temperatures of various components, including each of my NVME drives by running:
sensors
Sensors also supports the use of the -j flag to output in JSON form, so when combined with the jq package, I could
output just the temparature of one of my specific NVME drives with the following command:
sensors -j | jq '."nvme-pci-0b00"."Sensor 2"."temp3_input"'
nvme-pci-0b00, but yours will likely have a different name.
I would like to track this in Zabbix, so I can monitor it and check that it is not going above a certain temperature. This tutorial will show you how to do just that.
Steps
Configure The Server
Assuming that you have already set up the Zabbix agent on your server, we just need to adjust the Zabbix agent configuration file to add our custom metric/item.
sudo editor /etc/zabbix/zabbix_agent2.conf
Install jq on your server if you haven't already with:
Add the following line at the bottom:
UserParameter=drive.temperature[*],/usr/bin/sensors -j | jq '."$1"."Sensor 2"."temp3_input"'
UnsafeUserParameters=1 above this, but this should not be the case.
After having updated the configuration file, restart the Zabbix agent for the change to take effect:
sudo service zabbix-agent2 restart
Check that it is still running, to make sure there isn't an issue with your configuration:
sudo service zabbix-agent2 status
Configure Zabbix
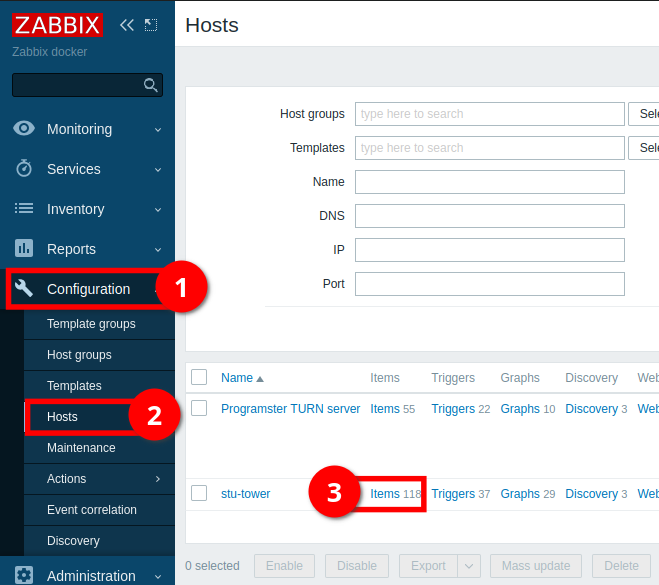
Log into your Zabbix server and go to Configuration (1) > Hosts (2), and then find the server that has the temperatures you wish to monitor, before then clicking on Items on its row. (3).
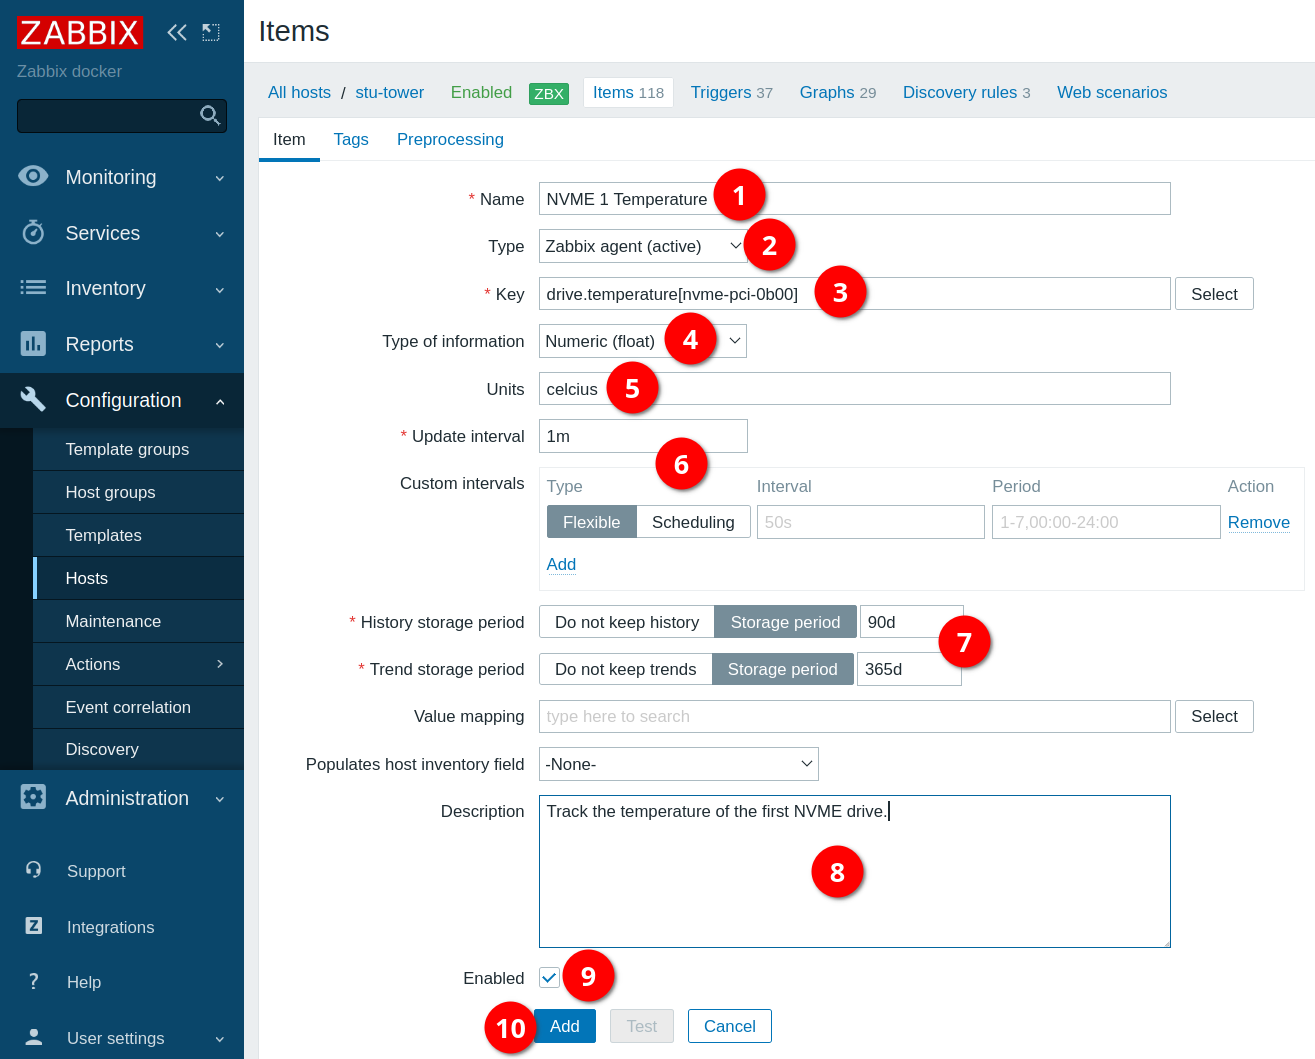
Click on Create Item in the top-right corner to create a new item.

- Give this item a name.
- Set the type to Zabbix agent or Zabbix agent (active) depending on if you have a passive or active setup.
- Set the key to how you configured it on your agent config earlier, swapping out the
*with the identifier for the device that sensors outputs. - Change the type of information to Numeric (float). The default of numeric (unsigned) won't work as it expects an integer it seems.
- Set the untis to "celcius"
- I left the update interval with the defaults of one minute.
- I left the storage periods as the default. Adjust if you desire.
- Fill in a description if you like.
- Leave the metric as enabled.
- Click Add once you are finished.
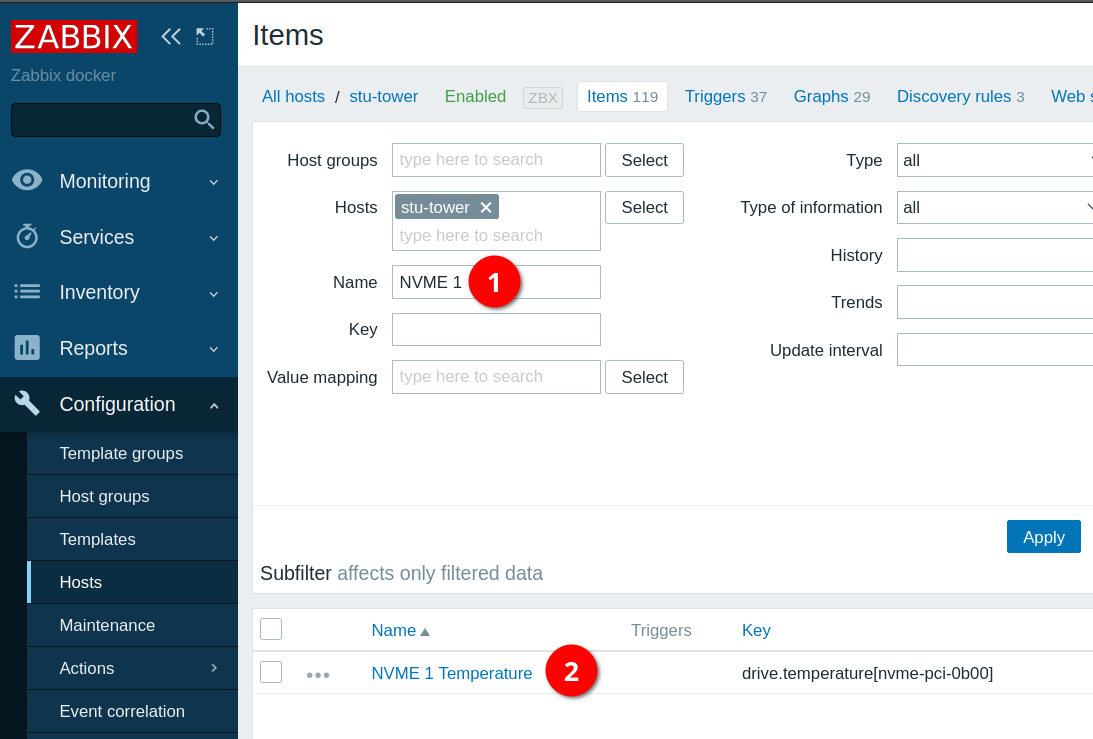
You will be taken back to the items page. To find the item you just added, the easiest way is to type part or all of the name into the name field (1) and it should show up in the results (2) as shown below:
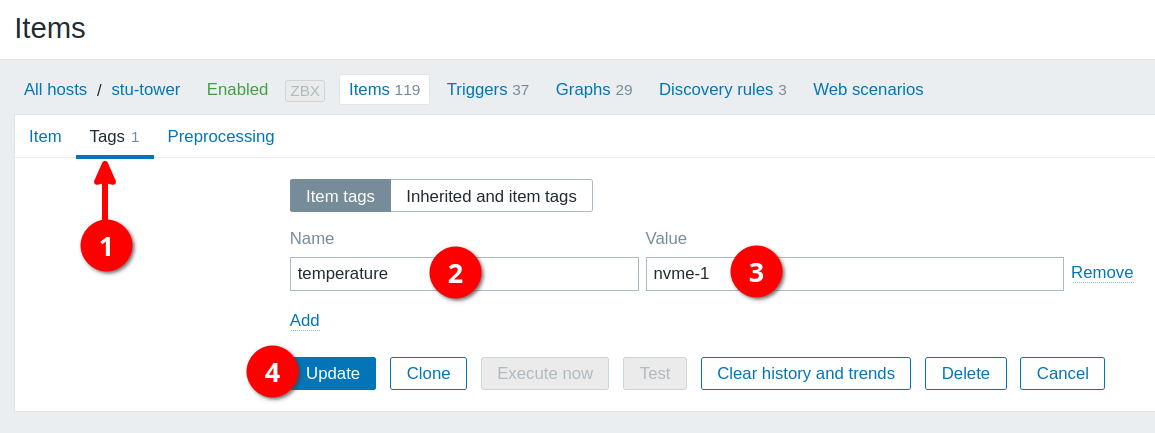
At this point, you may wish to click on the item to edit it again, then click Tags (1), before adding a tag name and value to this item. For me personally, I like adding all device temperatures under a tag named temperature (2) and then a value to identify it by (3). You can add any number of tags. When finished, click Update (4).
Now if you go to Monitoring (1) > Hosts (2), click on the host you were just configuring (3), and then click Latest data (4)...
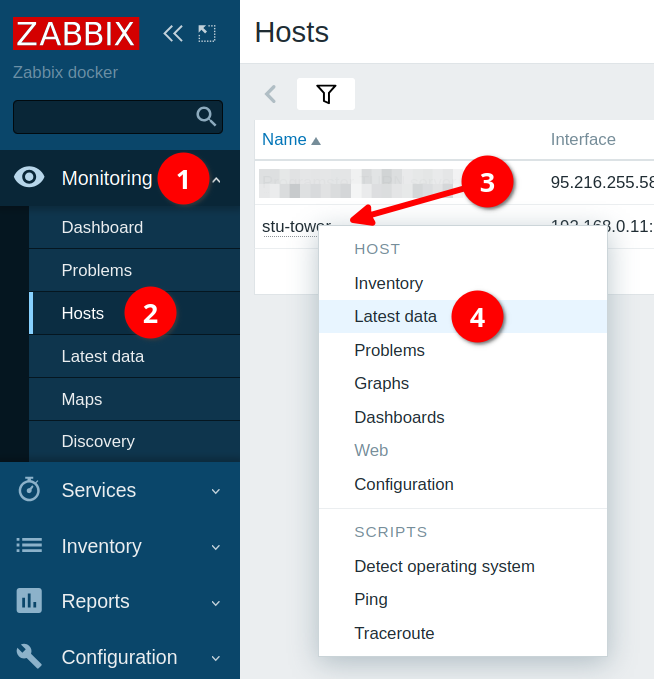
... You will see that you can filter by the tag you just added to your custom metric.
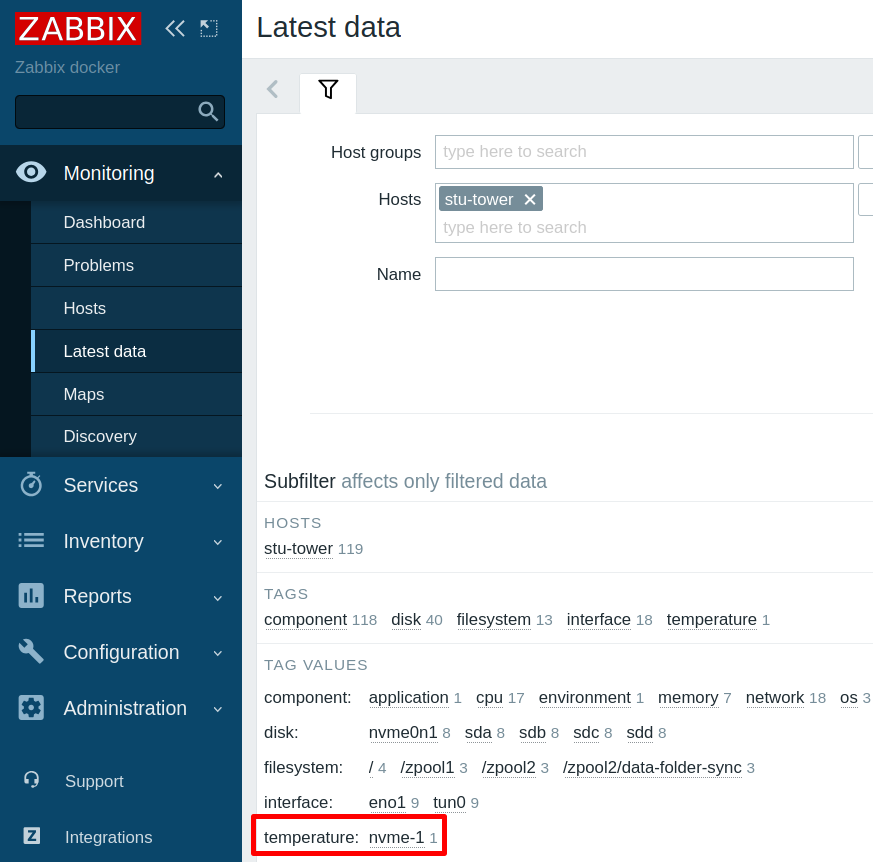
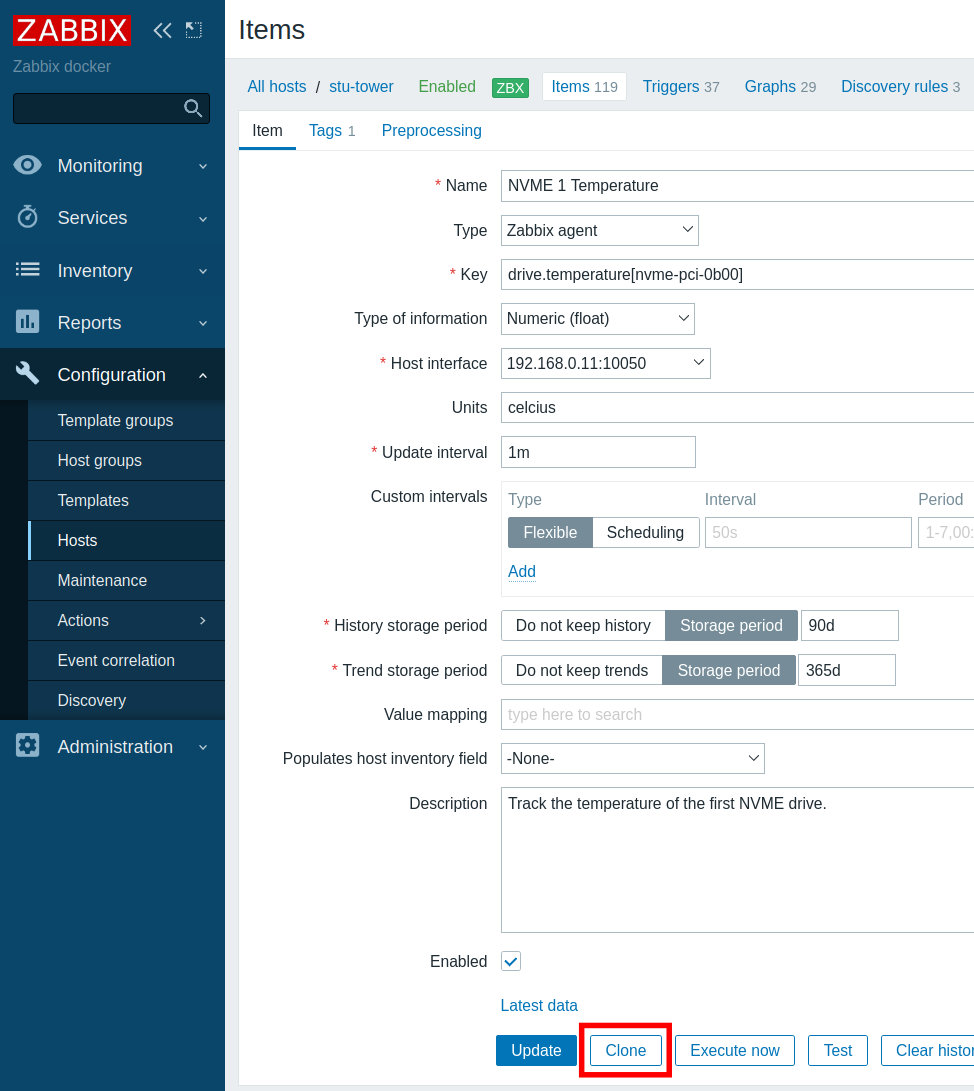
Finally, you probably have more than one device in sensors that you wish to monitor.
For each of these, simply go back to the item configuration and click Clone.
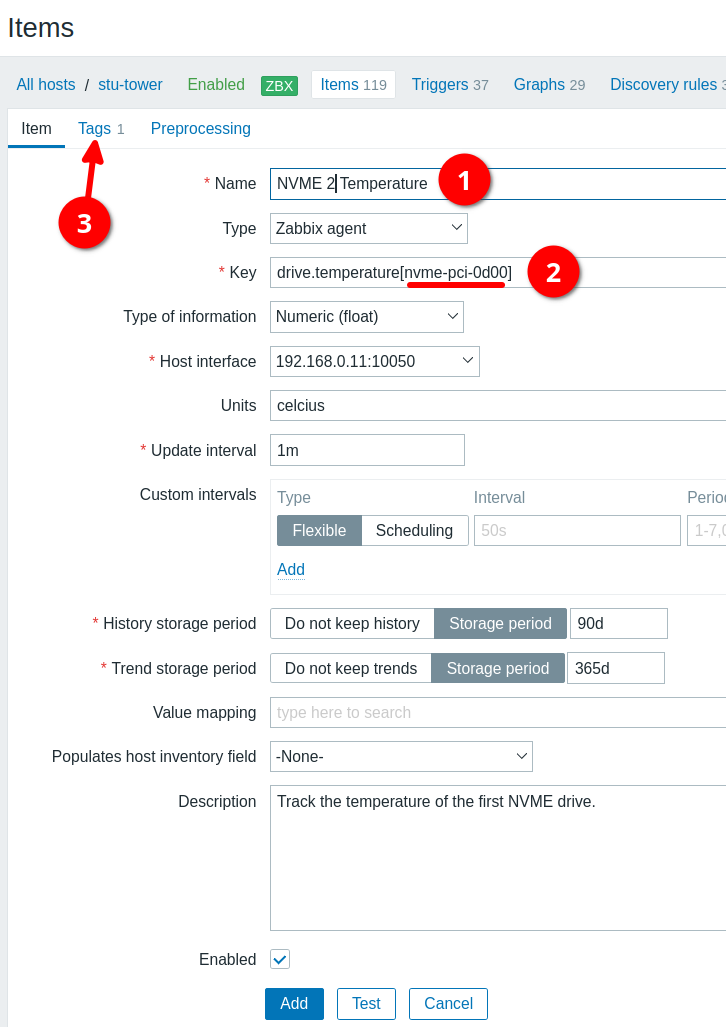
Then adjust the name (1), enter the appropriate sensors identifier (2), and update the tags as appropriate (3).
Create A Trigger
It would be great if we could be alerted if the temperature was getting too hot. We can do this by creating a custom trigger.
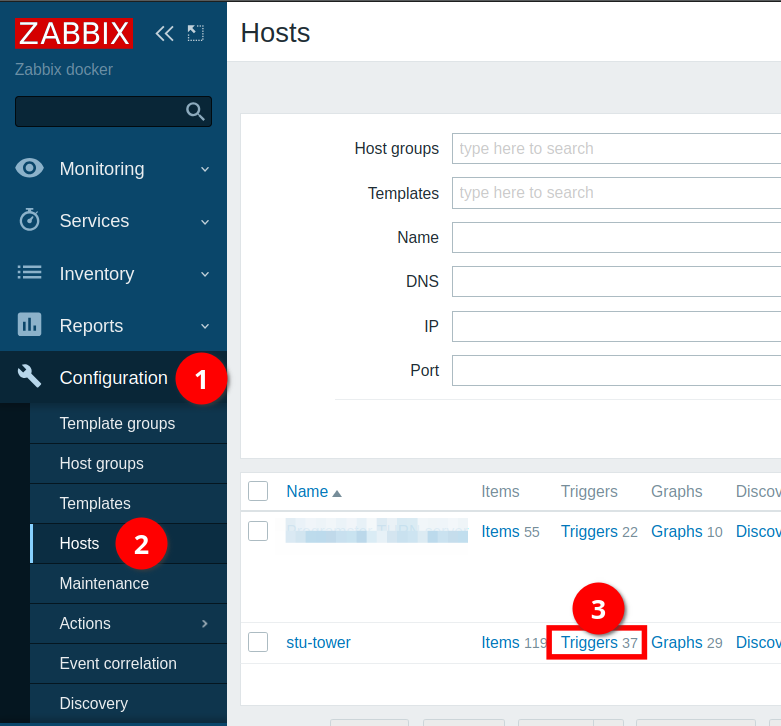
Go to Configuration (1) > Hosts (2) and click on Triggers (3) on the row of the host we are configuring.
Click the button in the top-right corner to Create trigger,

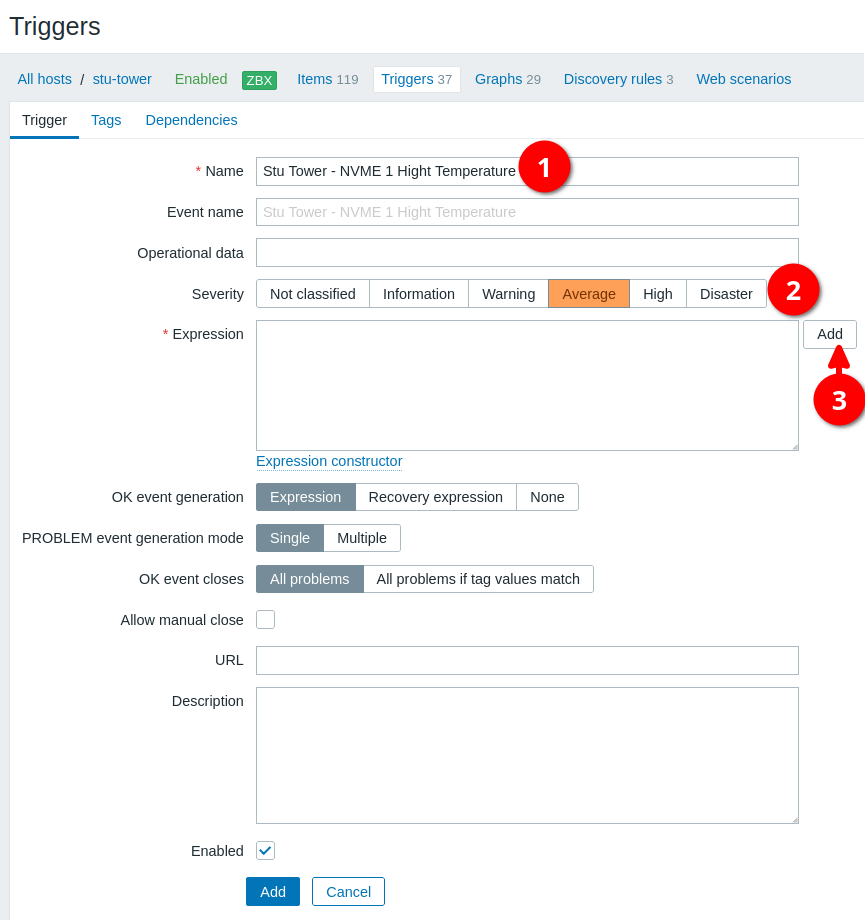
Give the trigger a name (1), before setting the severity level (2), and clicking Add for creating the expression to identify when to fire the trigger.

Give your trigger a name (1), before setting the** level of the alert (2)** and click Add (3) to bring up a modal to assist with creating an expression for when the trigger should fire.
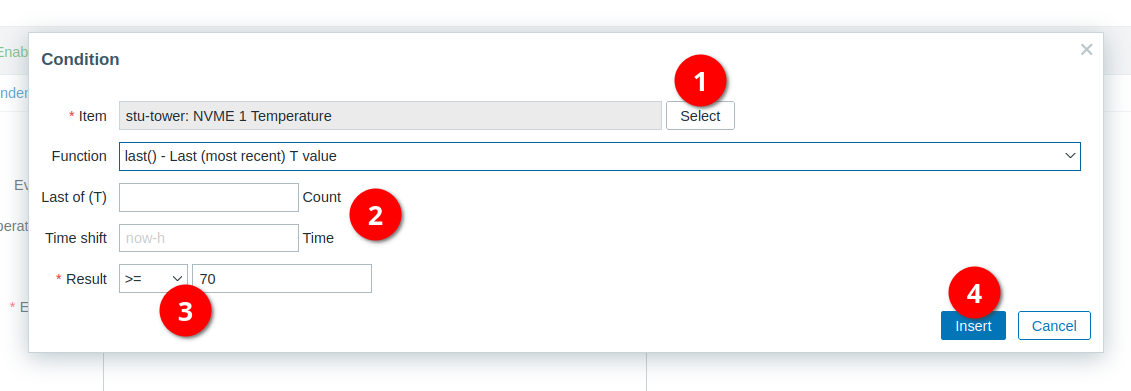
Use the Select box (1) to pull up a modal to help you select the item you created earlier for monitoring temperature.
I left these fields empty (2), but made sure to set the Result (3) to be >= the temperature at which point I would like to recieve an alert.
These NVME drives can run pretty hot, so I set this to 70 degrees, but my may wish to set yours lower. Then just click Insert (4).
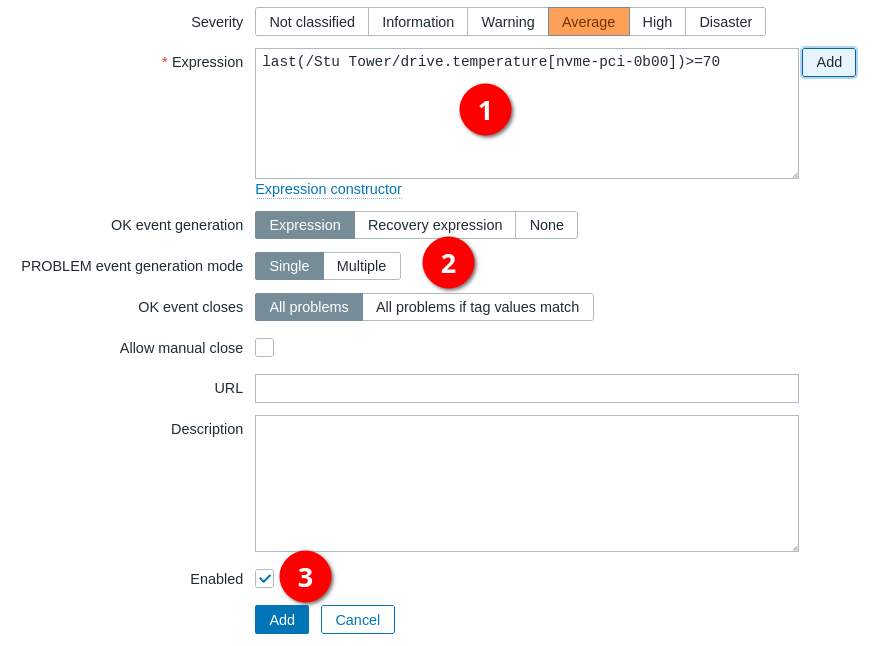
The expression should now show up (1). I found that the defaults were appropriate (2) for most of the options and I'm not going to go into detail abou them here, but they are pretty self-explanatory. Finally, make sure that the trigger is set to enabled and click Add.
Conclusion
You have now configured Zabbix to monitor the temperature of your device, and trigger an alert when its temperature gets too hot.
References
- Zabbix Blog - Handy Tips #36: Collecting custom metrics with Zabbix agent user parameters
- Youtube - Zabbix Handy Tips: Collecting custom metrics with Zabbix agent user parameters
First published: 17th July 2024
