Why Are There So Many Javascript Charting Libraries?
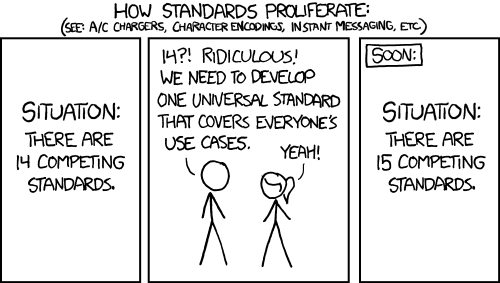
Javascript charting libraries are pretty much an extreme example of below:

Below is a a video of Dan Mané explaining this problem before introducing their new tool, Plottable. I decided to create this tutorial indexing the points in the video for self reference because he makes a lot of great points, and Plottable is one of the few charting libraries that supports Typescript.
- Example/Anecdote of The Problem
D3
- Starting To Look at D3 - All based on this one library
- D3: A Charting Library?
- D3: A Data Viz Library?
- D3: A DOM Manipulation Library
- D3 - Low Level, Incredible things are possible, but simple things are hard.
- Breakdown of Parts of Chart
- A look at the code for the parts of the chart
- The Strength and Weakness of D3
- Awkward otter "joke"? (skip me)
- Chartist's Approach
- The problem with all charting libraries - It's a trap.
- Discussing the presenter's approach to the problem and why they are going to have a whack at it - Plottable
- layout - build from parts and stitch together in a table.
- Create a basic chart quickly and iterate desired changes rapidly.
- Chartographer.js - Plottable in "easy mode" for a super simple/basic form to get you started and lead you onto plottable when you need customization.
- Step through difficulty level - chartogrepher -> plottable -> d3
- Discussing use of plottable.js for creating a custom data visualization for Eve online data
- Github area for Plottable.
Last updated: 16th August 2018
First published: 16th August 2018
First published: 16th August 2018
